Distributions flags
gFACs is capable of reformatting annotations into formats for distributions. It can provide distribution summaries or raw data. To signify distributions, a single flag followed by options may be used:
--distributions [option] [option] …
Activates the ability to create distributions. This task is always done last on the final version of the gene table. If a prefix is specified, all output files will reflect that.
All outputs are printed in a .tsv file that can be opened for viewing on excel or R. The options available for distributions are as follow:
exon_lengths
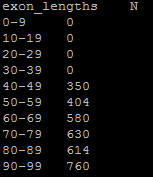
Creates the file exon_lengths_distributions.tsv. In it, a range of exon lengths and the corresponding representation is printed. In this example, --min-exon size was set to 40, which is reflected in the numbers:
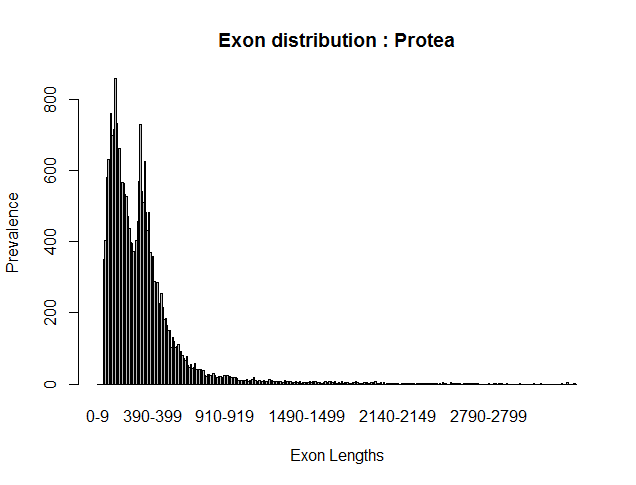
The above data, when rendered into a histogram using R, looks like this:
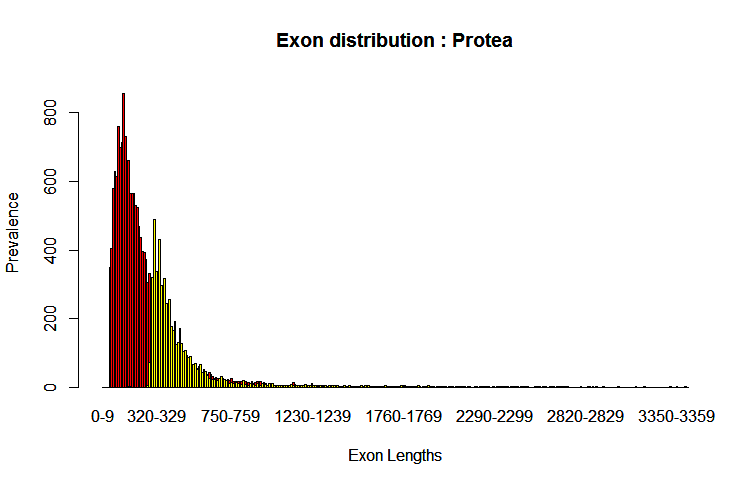
Notice that the curve is bimodal, which is indicative of the mono and multiexonic genes. Utilizing two runs one with --rem-monoexonics (red) and one with --rem-multiexonics (yellow) you can see the curves are indeed the difference in gene type where smaller exon lengths are in multiexonic genes:
Advanced: Zoom of exon lengths can be controlled with a trailing number. This changes the size of the step. In the example above, the range of values as the cluster for the distribution is 10, but it can be controlled like this:
exon_lengths 5
This would change the above table to:
The default, if no number is chosen, is decided by the maximum exon length of the provided data. For a maximum length that is less than 100 nucleotides, the step is 1. For a maximum value of exon length that is more than 100 but less than 1,000, the step is 10 and so on.
Changing this step number should not drastically change the time it takes to run. However, the file will be larger and have more lines when a smaller number is used!
intron_lengths
Creates the file intron_lengths_distributions.tsv. In it, a range of intron lengths and the corresponding representation is printed. The outputs and applications are identical to exon_lengths.
Advanced: Zoom of intron lengths can be controlled with a trailing number. This changes the size of the step. It can be controlled like this:
intron_lengths 20
The default, if no number is chosen, is decided by the maximum intron length of the provided data. For a maximum length that is less than 100 nucleotides, the step is 1. For a maximum value of intron length that is more than 100 but less than 1,000, the step is 10 and so on.
Changing this step number should not drastically change the time it takes to run. However, the file will be larger and have more lines when a smaller number is used!
CDS_lengths
Creates the file CDS_lengths_distributions.tsv. In it, a range of CDS lengths and the corresponding representation is printed. The outputs and applications are identical to exon_lengths.
Advanced: Zoom of CDS lengths can be controlled with a trailing number. This changes the size of the step. It can be controlled like this:
CDS_lengths 25
The default, if no number is chosen, is decided by the maximum CDS length of the provided data. For a maximum length that is less than 100 nucleotides, the step is 1. For a maximum value of CDS length that is more than 100 but less than 1,000, the step is 10 and so on.
Changing this step number should not drastically change the time it takes to run. However, the file will be larger and have more lines when a smaller number is used!
gene_lengths
Creates the file gene_lengths_distributions.tsv. In it, a range of gene lengths and the corresponding representation is printed. These sequence lengths do include all introns. The outputs and applications are identical to exon_lengths.
Advanced: Zoom of gene lengths can be controlled with a trailing number. This changes the size of the step. It can be controlled like this:
gene_lengths 1000
The default, if no number is chosen, is decided by the maximum gene length of the provided data. For a maximum length that is less than 100 nucleotides, the step is 1. For a maximum value of gene length that is more than 100 but less than 1,000, the step is 10 and so on.
Changing this step number should not drastically change the time it takes to run. However, the file will be larger and have more lines when a smaller number is used!
exon_position
Analyzes and creates an output that evaluates exon position in a gene to its size. Position meaning which exon comes first. In positive strand genes, these are in the order they appear in the gene table. For reverse strand genes, the first exon is the last one to appear in the gene table. Creates the output file exon_position_distributions.tsv. The output looks like this:
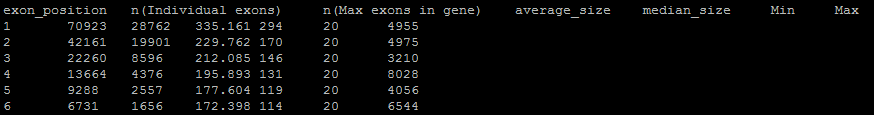
Exon position goes from 1 to whatever the maximum number of exons in one gene is. It will match what a statistics output would say. The second column is how many exons are representative of that position. The first exon support (70,923 above) will always be equal to the overall number of genes because even monoexonics have a first exon. (You can remove those, of course). You can also say there are 70,923 first exons, 42,161 second exons, etc…
The third column is how many genes have the first column number as their maximum number of exons. So, in the last row shown, there are 1,656 genes that have 6 total exons. There are 28,762 monoexonics then as well by this same logic.
The third and fourth columns are average and median size of an exon at that positon. The last two are minimum and maximum. If you use a minimum exon parameter (as I did above) it will be reflected!
exon_position_data
Provides the raw data in data_intron_position_distributions.tsv on exon positions alongside exon_position_distributions.tsv produced from the command above. This set of data can be used to make boxplots.
The data appears like this:
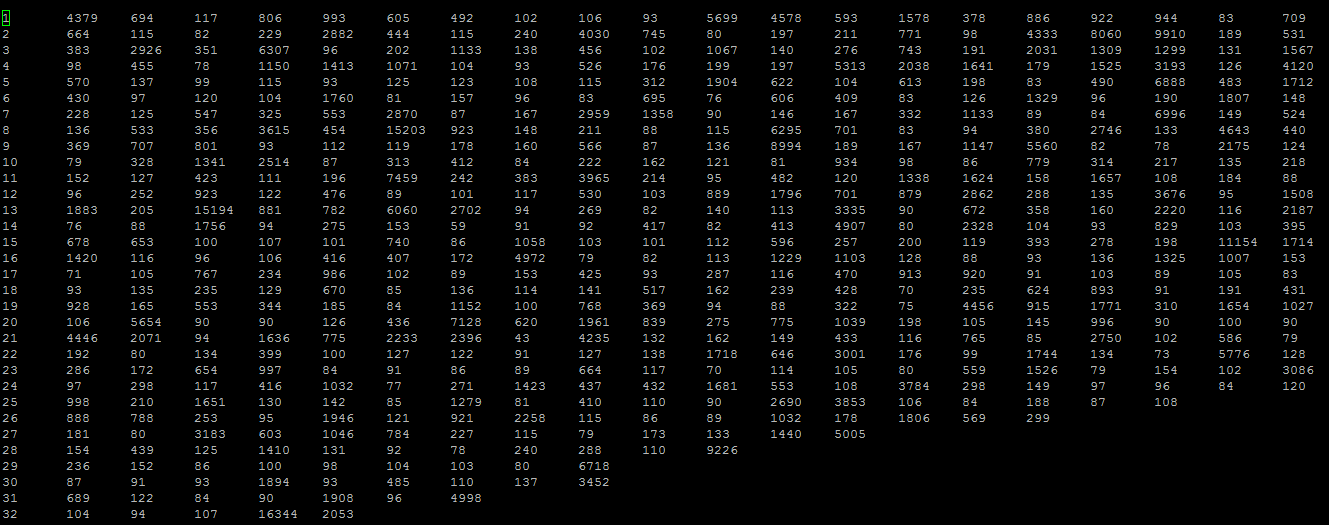
The first column is the exon position and the following values in the row are the sizes of exons (non-sorted). The row will have as many columns as exon position data points. Notice how 32 (the last visible row) has only 5 numbers, showing there are only 5 genes that have a 32nd exon where the values are the sizes.
intron_position
Intron positioning works identically to exon positions. However, this will only include multiexonic genes! All header names have the same meaning as exon position.
Creates the output file intron_position_distributions.tsv.
intron_position_data
Intron position raw data works identically to exon positions and will also only include multiexonic genes. Creates the output file data_intron_position_distributions.tsv and the default intron_position_distributions.tsv.
A sample of a boxplot that can be created:
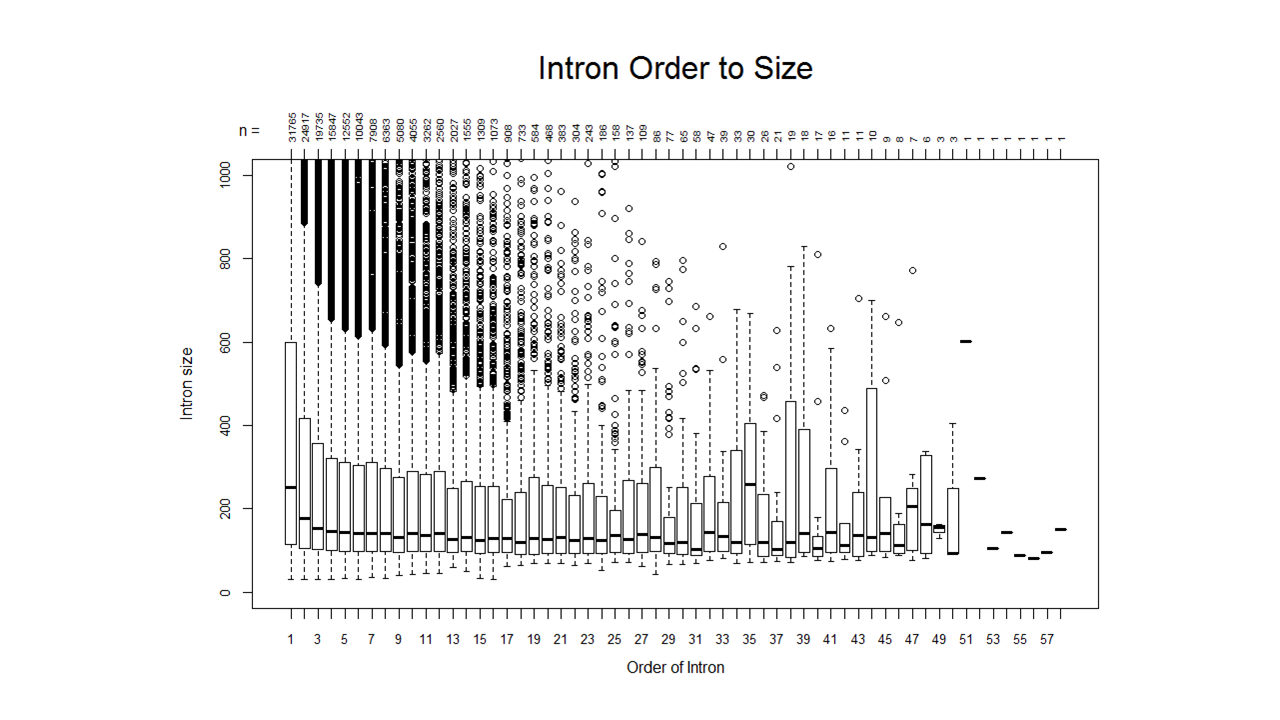
For how I created the boxplot, feel free to contact me!